Overview
Conjoint Analysis is a quantitative survey method that helps identify which combinations of features or attributes matter most to customers. Within GLIDR, this technique supports product feature testing by:
- Creating assumptions for each feature being tested
- Connecting those ideas to an Experiment with specific hypotheses
- Running the Experiment and attaching the Conjoint Analysis as Evidence
- Analyzing learnings and updating the project accordingly
In Brief
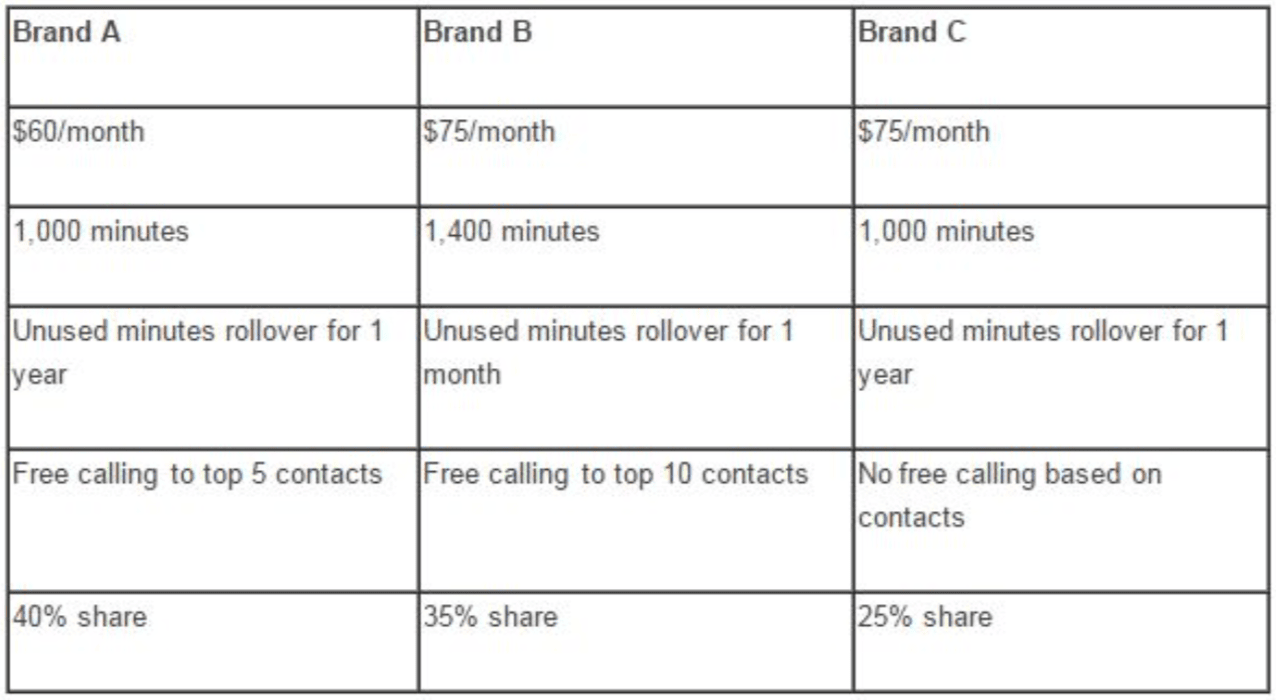
A complex survey method where customers choose between product offerings with different attributes (price, screen size, weight, etc.). Statistical analysis reveals the relative value of each attribute and predicts values for feature combinations.
Helps Answer
- Does a particular new feature have customer value?
- Which product attributes matter more/less to customers?
- What dollar value can be assigned to each feature?
- Which features should we build next?
Tags
Quantitative, Pricing, Revenue, Value Proposition
Description
Time Commitment and Resources
Analysis requires 1-2 hours offline for B2C or 24 hours online for response gathering. B2B recruitment varies widely. Data analysis is rapid for fewer than 10 attributes using off-the-shelf software; analyzing dozens of factors may require weeks and expert consultation.
How To
- Identify top 3-5 product attributes based on prior research and consumer understanding
- Calculate sample size using: [(Total # of levels for all attributes) - (Number of attributes + 1)] × 10
- Use software to mix attributes into new product offerings
- Show participants selected offerings side-by-side for preference selection
- Employ statistical analysis software to compute relative value rankings for each attribute
- Generate formula revealing the "ideal" product based on optimized attribute mix
Interpreting Results
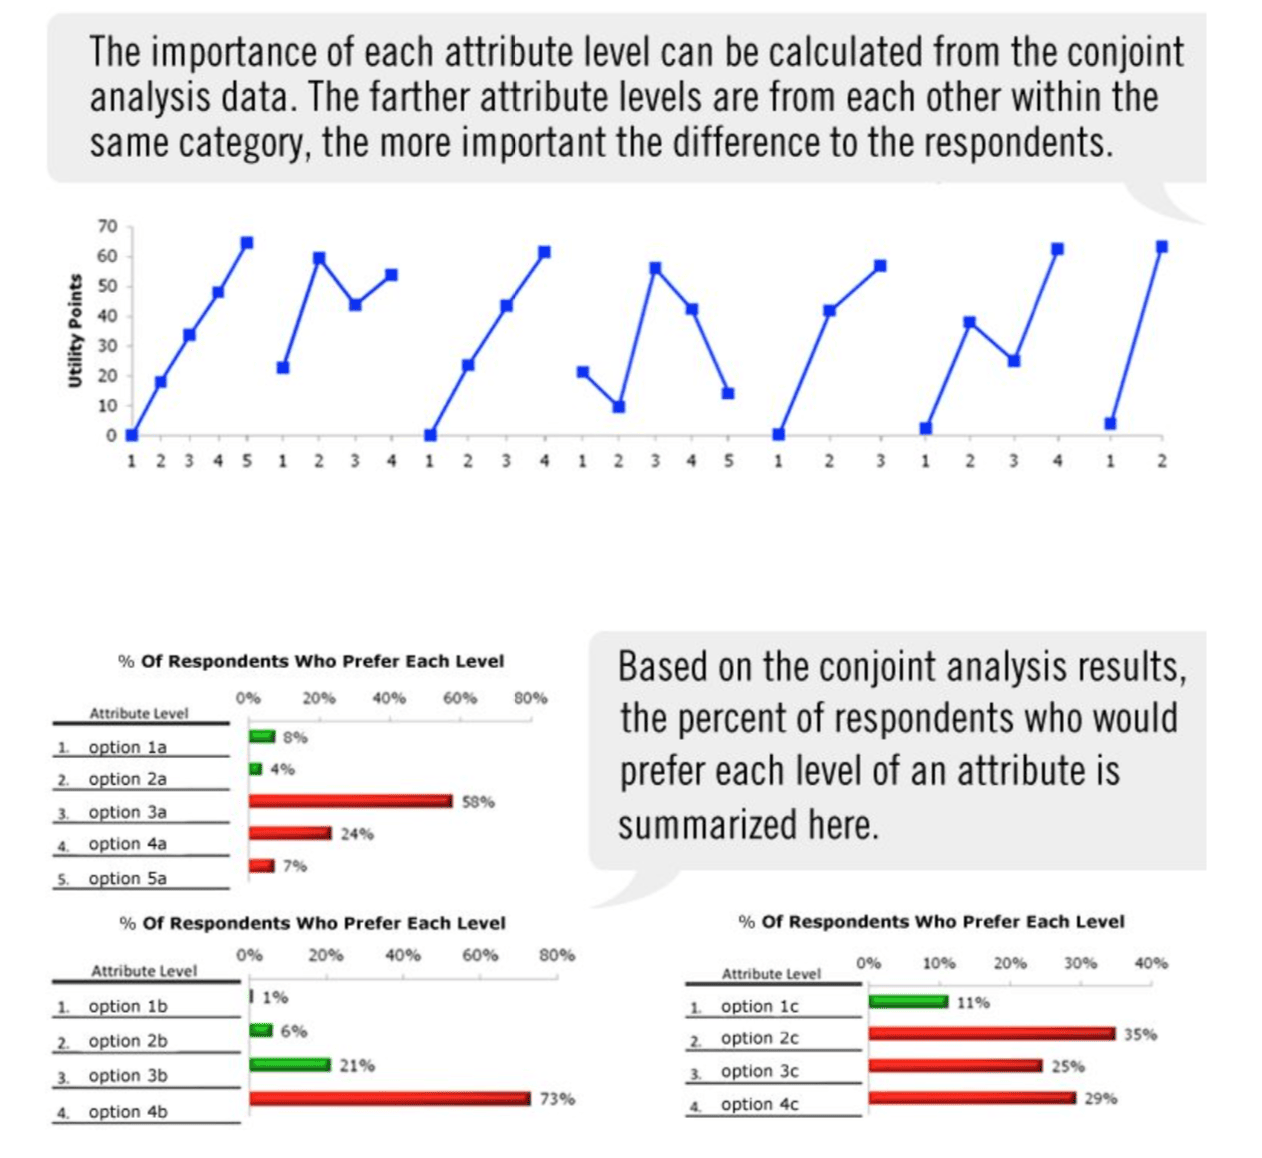
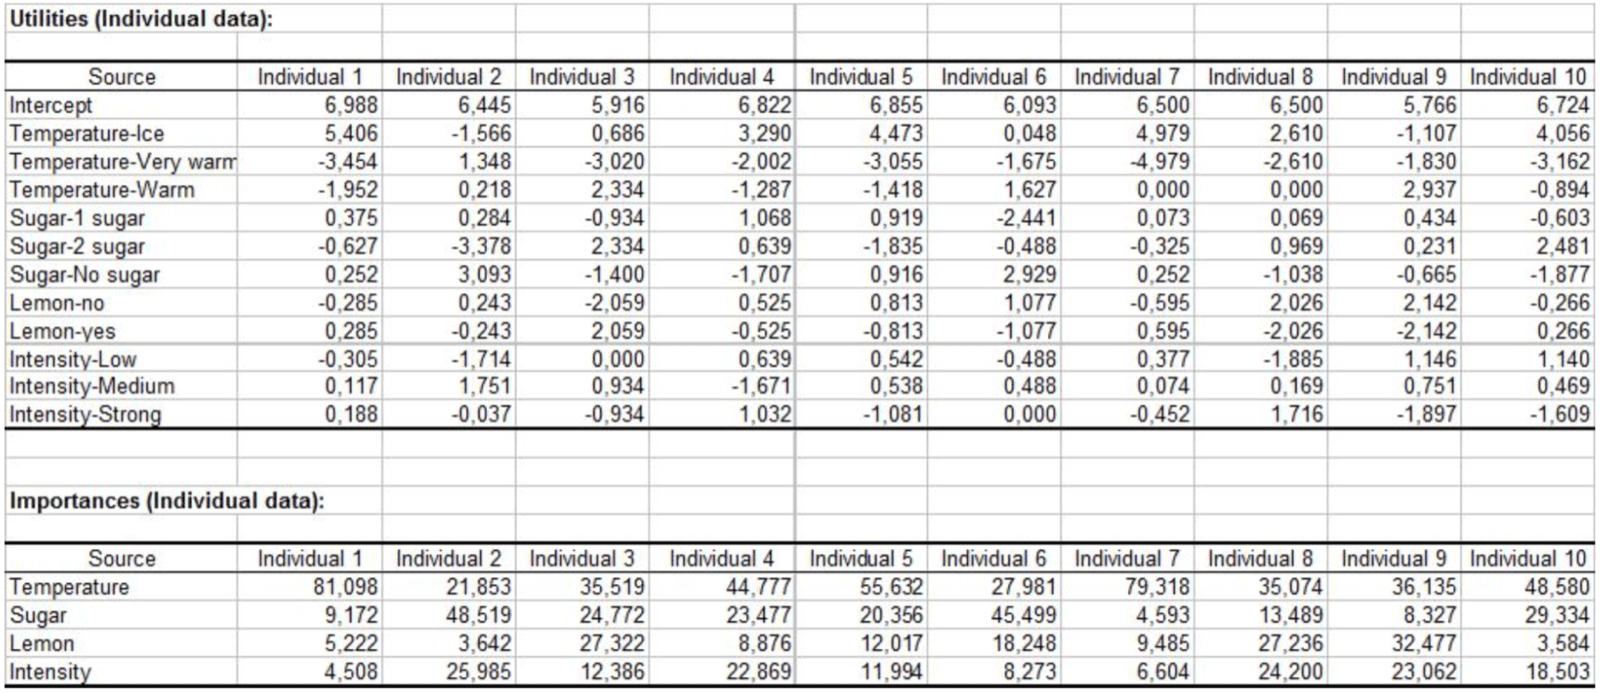
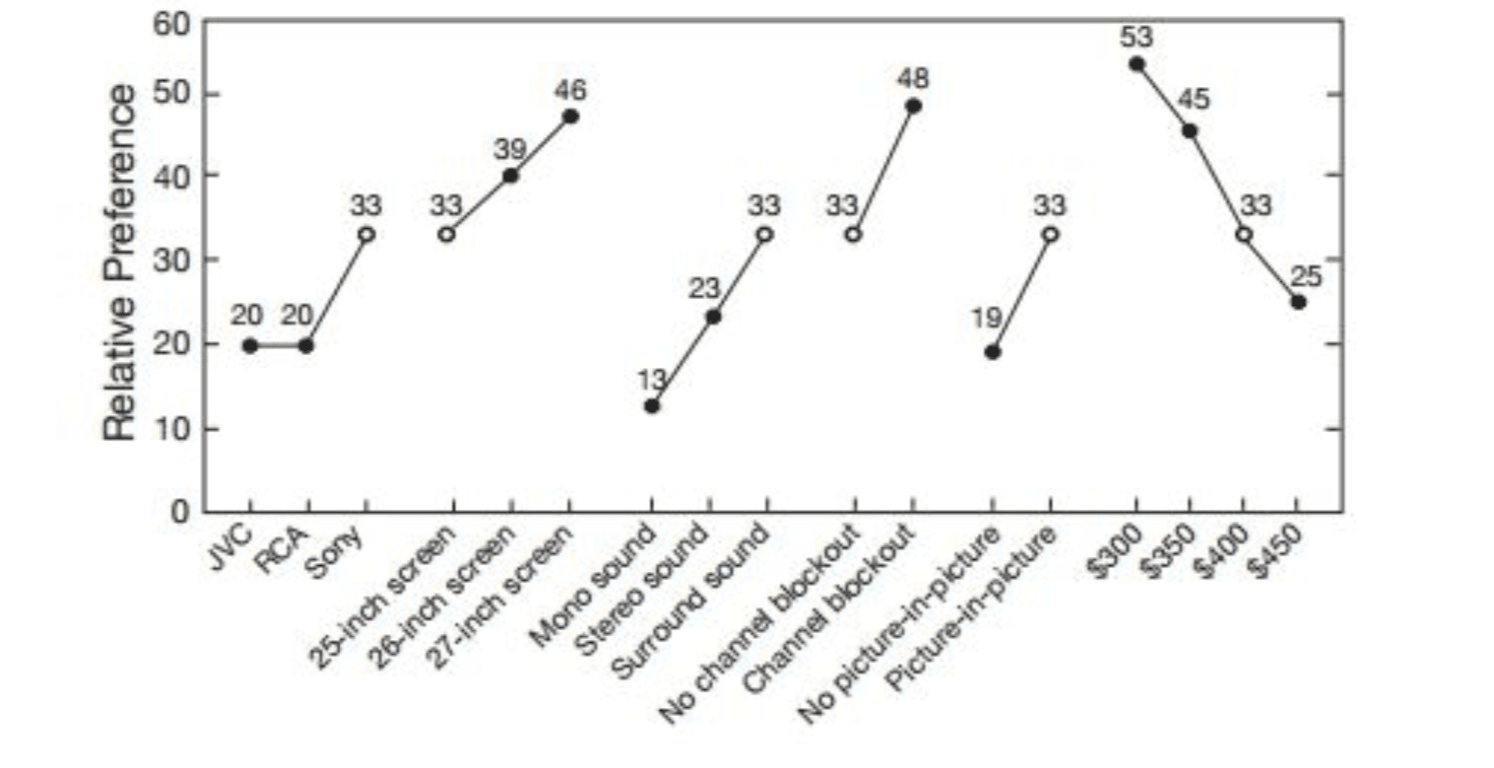
Results can be statistically complex and difficult to understand. Various display methods exist—from detailed statistical outputs to simplified relative parts-worth sensitivity analyses. What matters most is: the relative importance of each attribute compared with the others; the formula that allows you to predict relative preferences of any mix; elasticity of demand for pricing simulations.
Key considerations:
- Most effective in existing markets where product attributes are known
- New attributes may produce inaccurate valuations since customers lack understanding
- Generally requires generative research beforehand to validate tested attributes
- Requires high expertise to design; rarely used in early-stage projects
Potential Biases
- Confirmation Bias: Face-to-face administration risks entrepreneur over-explanation or nonverbal prompting
- Invalid Target Audience: Requires deep audience understanding; works best for logical comparison products, not emotional/impulse purchases
- Homogenous Market: Treating all segment members identically overlooks attribute preference shifts outside studied price ranges
- Price Sensitivity: Conjoint analysis indicates price sensitivity but requires separate pricing and elasticity analysis for exact pricing